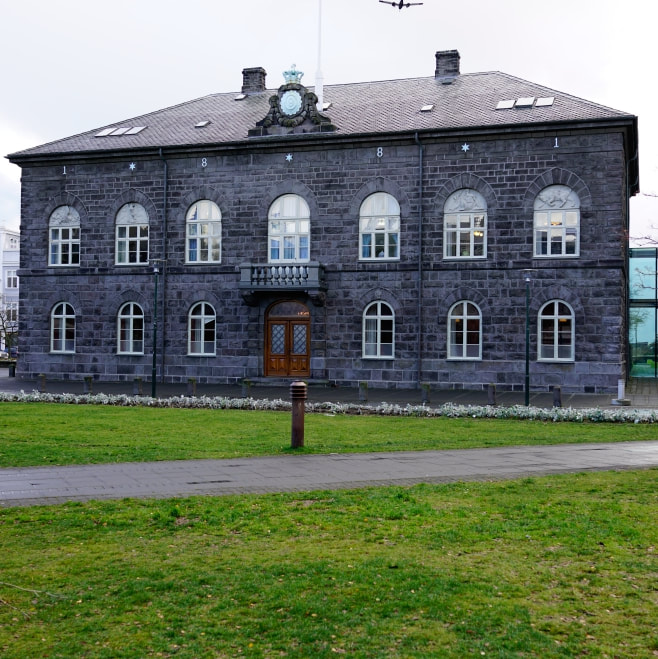
 Photo: Páll Stefánsson. The final results are in for the Icelandic parliamentary election. They are as follows, according to RÚV. The Independence Party: 25.2 percent or 16 MPs Left-Green Movement: 16.9 percent or 11 MPs The Social Democratic Alliance: 12.1 percent or 7 MPs The Center Party: 10.9 percent or 7 MPs The Progressive Party: 10.7 percent or 8 MPs The Pirate Party: 9.2 percent or 6 MPs The People’s Party: 6.9 percent or 4 MPs Reform Party: 6.7 percent or 4 MPs Other parties did not achieve the 5 percent voter support needed to be represented in Alþingi, the Icelandic parliament. Voter turnout was 81.2 percent. Last year’s voter turnout was 79.2 percent, the lowest in Iceland’s history. It was 81.5 percent in the 2013 parliamentary election, which in that year was a historical low. According to Kjarninn, the percentage of women MPs has decreased from 47.6 percent to 36.5 percent (30 seats to 23). This is the lowest number of women MPs since before the banking collapse in 2008. A governing coalition needs 32 seats to form a majority government: final numbers show at least three parties will be needed to do so. It is likely a coalition could consist of four parties. RÚV has published a list with the names of all members of parliament. You can see it here.
0 Comments
Your comment will be posted after it is approved.
Leave a Reply. |